 Equal Housing Lender. Bank NMLS #381076. Member FDIC.
 Equal Housing Lender. Bank NMLS #381076. Member FDIC.
July 26, 2022—It’s hard to avoid the “R” word these days. The question of whether the economy is headed toward a recession has been front and center, almost superseding concerns about inflation. During our May webinar “Growth Scare or Recession?”, we explained our reasoning for the U.S. to avoid the latter, but since that time the risks have risen noticeably. After first quarter data on economic growth showed a contraction, and with potential for a second quarter of contraction when data is released on July 28th, one consideration that has bubbled up is the (seemingly) simple question of how a recession is defined. Typically, there is less debate about definitions because most recessions tend to coincide with a clear slowing in the economic data. However, current economic data are sending very mixed signals on the strength of the economy given the unique nature of the pandemic recession and recovery. Our base case scenario still looks for the economy to slow, but to avoid recession. While a second quarter of contraction would raise alarm bells by triggering a technical recession, details around sectors of the economy driving that contraction will be important for determining whether the recession will be broad-based, persistent, and deep, and therefore a greater concern for the outlook.
Recessions defined: NBER vs. technical recession
Economists and markets traditionally refer to recessions as determined by the Business Dating Cycle Committee of the National Bureau of Economic Research (NBER), a group of eight private, nonpartisan economists. An “NBER recession” is defined as “a significant decline in economic activity that is spread across the economy and that lasts more than a few months.” So “depth, diffusion, and duration” of the economic decline are all important criteria.
A wide variety of indicators of economic activity based on data from national statistical agencies is used in the NBER’s assessment, including measures of inflation-adjusted consumer spending and income, employment, and industrial production, among others. However, there are no hard and fast rules about how the committee weighs these different indicators in making their determination. Instead, the process is more subjective—as Supreme Court Justice Potter Stewart noted in a 1964 ruling, “I know it when I see it.” In addition, it typically takes some time for official recession designations to be declared. The start of the Great Recession was announced in December 2008, one full year after it was determined to have started.
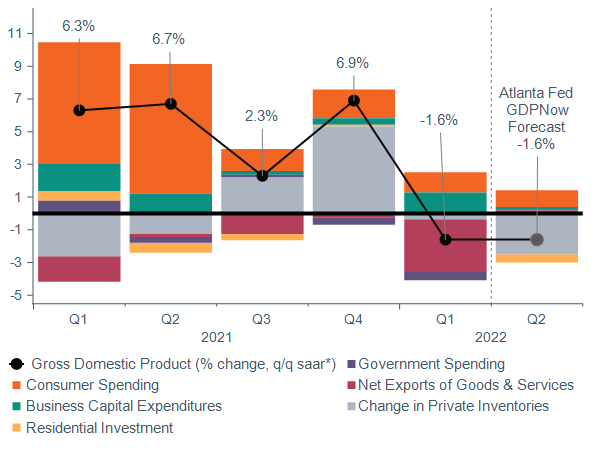
Another frequently cited definition, “technical recession,” sets a simpler bar, merely requiring economic activity as measured by gross domestic product (GDP) to contract for two consecutive quarters. By this metric, the likelihood of recession has risen substantially. We’ve already seen growth of -1.6% on a quarter-over-quarter (q/q) annualized basis in the first quarter of this year. And estimates of second-quarter GDP have slowly been deteriorating, with the Federal Reserve Bank of Atlanta’s (Atlanta Fed) GDPNow, a closely watched growth forecasting model, currently projecting GDP growth of -1.6% q/q annualized as of July 19th (Figure 1) which, if it materializes, would constitute a technical recession. However, the median of Bloomberg consensus forecasts still looks for positive growth of +0.7%q/q annualized.
Figure 1: Atlanta Fed GDPNow forecast for 2Q 2022 raises the possibility of technical recession

*Percent change, quarter-over-quarter seasonally adjusted annual rate
Data as of: 1Q 2022 for GDP and July 19, 2022 for Atlanta Fed GDPNow forecast.
Sources: Bureau of Economic Analysis, Federal Reserve Bank of Atlanta.
Current indicators of economic activity sending mixed signals
As we noted during the May webinar, negative growth in 1Q 2022 on its own was not overly concerning, as it was driven by very volatile components (inventories and net exports), which tend to revert. In NBER terms, the 1Q decline was not “diffuse.” In addition, a number of alternate measures of growth and other economic indicators are not painting a picture of an economy in recession. Final sales to domestic purchasers, a measure of growth that excludes inventories and net exports, actually grew by 2% q/q annualized in 1Q, suggesting still-solid domestic demand. In addition, gross domestic income (GDI), an alternate measure of growth based on income earned,[1] rose by 1.8% q/q annualized in 1Q. As we look at second quarter growth, the Atlanta Fed’s forecast for a decline is again being led by the volatile inventory component of growth, which is notoriously difficult to forecast. Other key indicators of growth like the Institute for Supply Management (ISM)® manufacturing and services purchasing manager indexes, as well as payroll job gains, indicate a slowing of the economy from a very elevated pace of growth, but are not currently signaling recession.
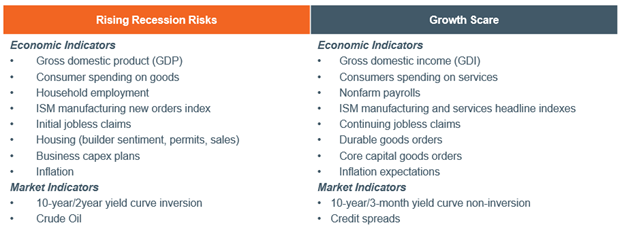
However, we do not entirely dismiss concerns of recession. If GDP does contract for a second straight quarter, it would raise concerns about the outlook for growth, as all instances of technical recession going back to the 1950s have eventually been designated as NBER recessions.[2] In addition, the pace of consumer spending on goods and indicators on business plans for capital expenditures (capex) are showing signs of slowing. The table below highlights some additional indicators we are watching that are pointing toward rising recession risks, though others that are suggesting a still solid economy (Figure 2). If 2Q GDP contracts, we will be closely monitoring whether the contraction is broad based across key sectors of the economy. In particular, we will be watching for any signs of material slowing in consumer spending and business capex as these are key underlying drivers of the trend in growth.
Figure 2: Economic and market indicators are sending mixed signals

Data as of: July 26, 2022. Source: WTIA.
Core narrative
Our base case scenario looks for modest GDP growth of 1.5%–2.0% in 2022, as we expect CPI inflation to decelerate to a more moderate (though still elevated) pace of 6.8% y/y by year end (from 9.1% y/y as of June). In our view, this should enable the Fed to slow its pace of hikes later this year and allow the economy to skirt recession. But recession risks are rising, and we currently estimate the probability at roughly 30%–40% (as noted in the July/August issue of Capital Perspectives). Last month, our Investment Committee trimmed allocations to leveraged loans and emerging markets equities, adding the proceeds to investment-grade bonds. Equities are now at a neutral allocation, cash remains elevated, and bonds represent a modest underweight. We continue to monitor the economy and markets and will adjust portfolios accordingly.
[1] The Bureau of Economic Analysis (BEA) defines gross domestic income as “a measure of U.S. economic activity based on incomes. In theory, GDI should equal gross domestic product, but the different source data yield different results. BEA considers GDP more reliable because it’s based on timelier, more expansive data.”
[2] There are however instances of the NBER declaring recessions without instances of technical recession. NBER recessions that started in 3Q 1960 and 2Q 2001 are examples in which the economy experienced quarters of negative growth that were interspersed with quarters of positive growth, rather than two consecutive quarters of negative growth.
Disclosures
Facts and views presented in this report have not been reviewed by, and may not reflect information known to, professionals in other business areas of Wilmington Trust or M&T Bank who may provide or seek to provide financial services to entities referred to in this report. M&T Bank and Wilmington Trust have established information barriers between their various business groups. As a result, M&T Bank and Wilmington Trust do not disclose certain client relationships with, or compensation received from, such entities in their reports.
The information on Wilmington Wire has been obtained from sources believed to be reliable, but its accuracy and completeness are not guaranteed. The opinions, estimates, and projections constitute the judgment of Wilmington Trust and are subject to change without notice. This commentary is for informational purposes only and is not intended as an offer or solicitation for the sale of any financial product or service or a recommendation or determination that any investment strategy is suitable for a specific investor. Investors should seek financial advice regarding the suitability of any investment strategy based on the investor’s objectives, financial situation, and particular needs. Diversification does not ensure a profit or guarantee against a loss. There is no assurance that any investment strategy will succeed.
Past performance cannot guarantee future results. Investing involves risk and you may incur a profit or a loss.
Indexes are not available for direct investment.
Reference to the company names mentioned in this blog is merely for explaining the market view and should not be construed as investment advice or investment recommendations of those companies. Third party trademarks and brands are the property of their respective owners.
 Equal Housing Lender. Bank NMLS #381076. Member FDIC.
What can we help you with today